Written by Praveen Kumar
Friday, June 05, 2026
Reduce the Carbon Footprint of Valve Development with Virtual Flow Loop Testing
By
Praveen Kumar

Physical testing has always been a critical part of a new valve product development. It gives manufacturers confidence in flow performance, reliability, and safety before a product reaches the market. Physical testing is usually evaluated through the lens of cost and time. The prototype cost, laboratory charges, test slot availability, logistics, and product launch delays are visible and easy to quantify.
However, physical testing also carries a less visible environmental footprint.
The Hidden Carbon Footprint of Valve Testing
Before a valve is mounted on a test rig, raw materials are procured, a prototype is manufactured, machined, assembled, and transported. Once it reaches the laboratory, the testing process then consumes energy through pumps, instrumentation, flow loops, and test infrastructure. Depending on the application, it may also require water, gas, or other working media. If the test outcome does not meet the target performance, the design is modified, and the cycle repeats.
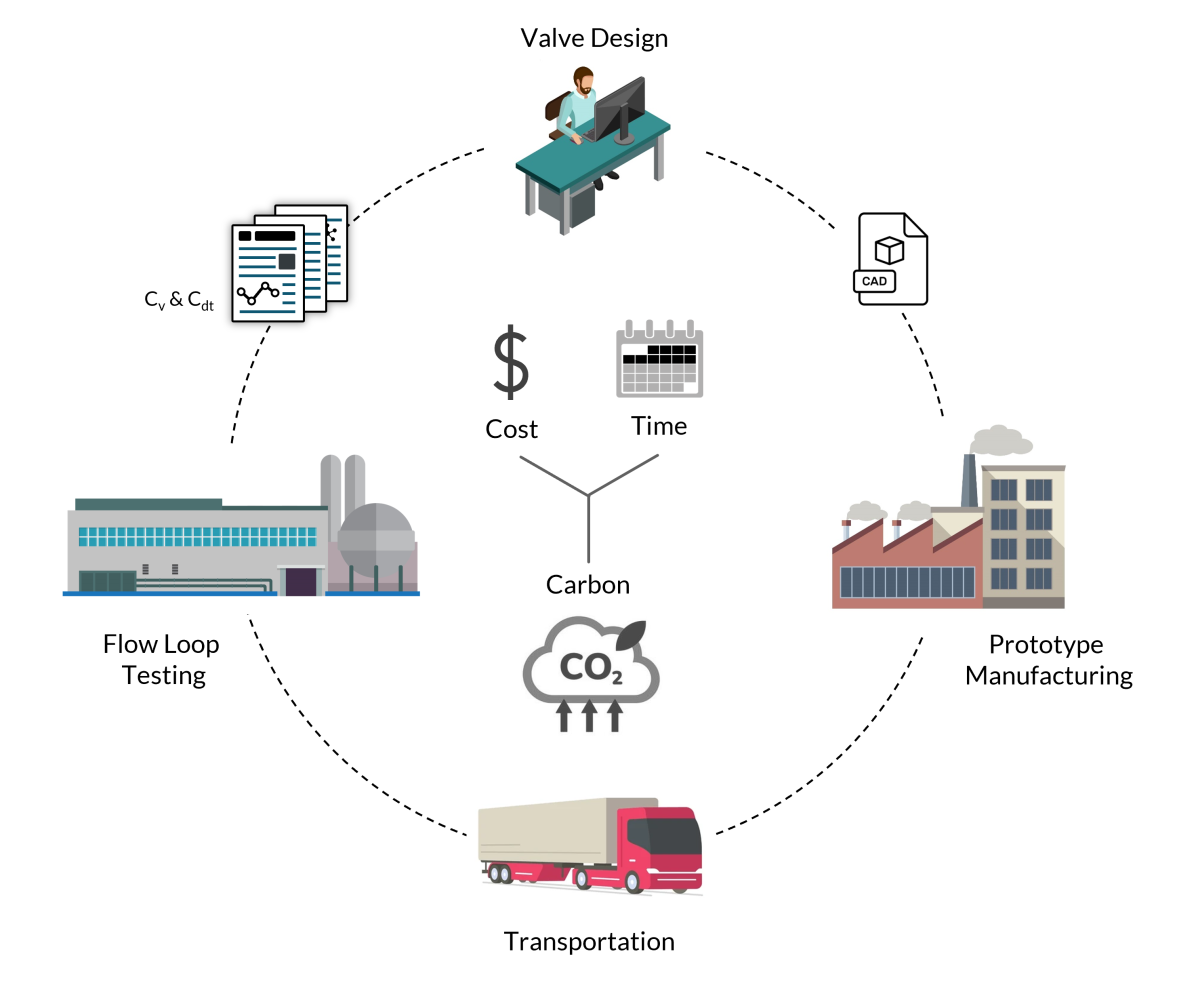
New Product Development Cycle
This means the carbon footprint of physical valve testing is not limited to the laboratory. It is distributed across material usage, prototype manufacturing, machining, logistics, test media handling, and energy consumption.
The Prototype footprint
Public valve Environmental Product Declarations (EPD) show that valve products already carry measurable embodied carbon before testing even begins. For example, Reported A1–A3 product-stage impacts include 4.16 kg CO₂e per kg of PVC-U ball valve from GF Piping Systems, 3.46 kg CO₂e GWP-total for BROEN BALLOMAX valves, 5.02 kg CO₂e GWP-total for Sigeval butterfly valves, and 27.4 kg CO₂e per kg for stainless-steel hydronic control and balancing valves from Frese/Vexve. These values should not be compared as a direct product ranking because declared units and product types differ, but they make one point clear: a prototype already carries the footprint of material extraction, manufacturing, machining, assembly, packaging, and upstream logistics.
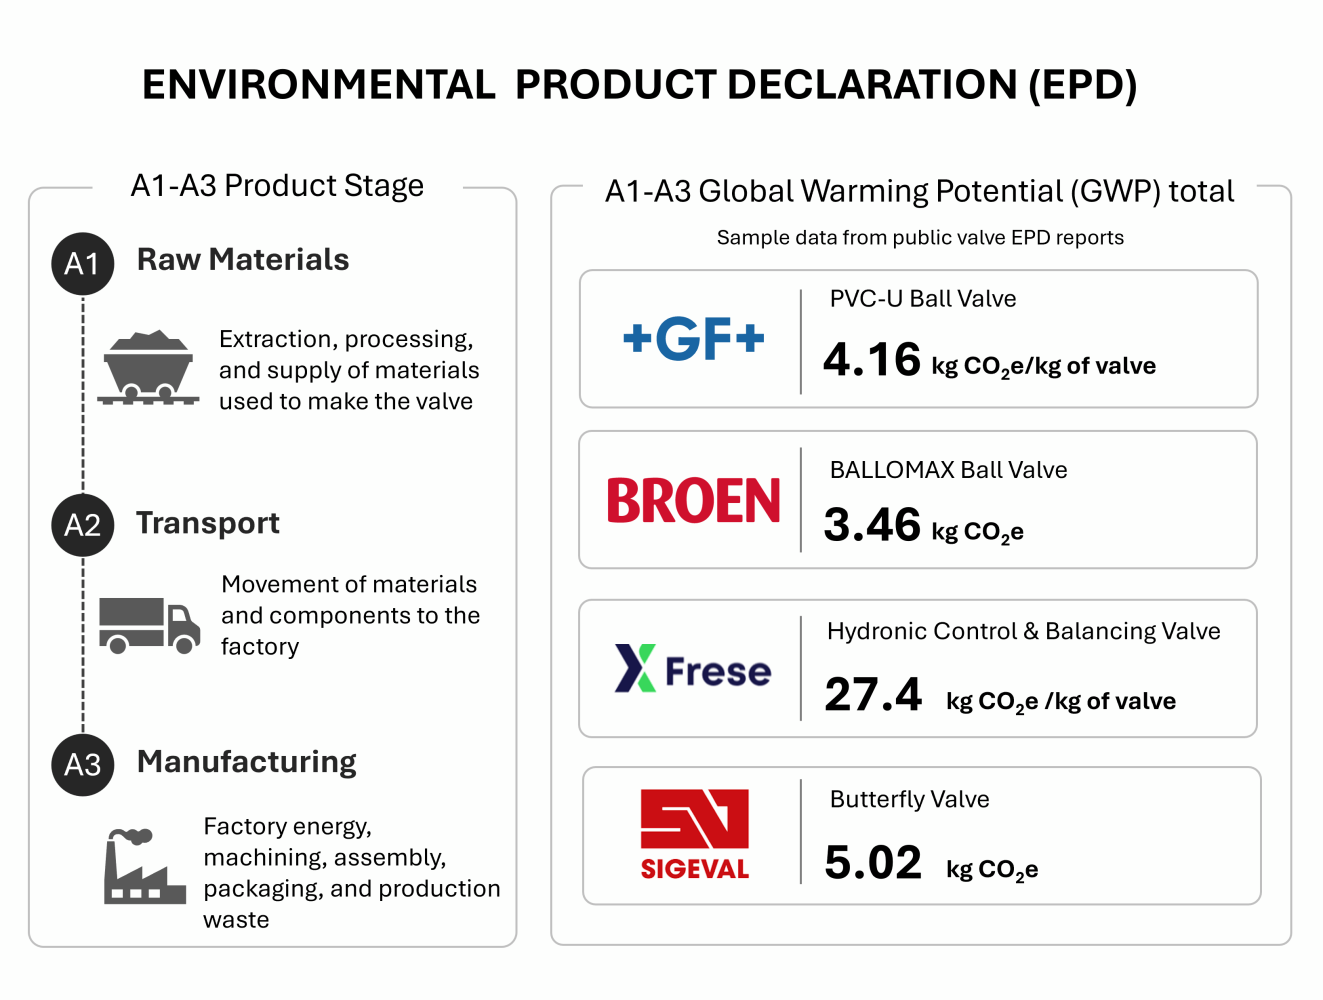
Valve Environmental Product Declarations (EPD) sample data
Transportation Footprint
Transportation adds another layer. Valve prototypes are often shipped from the manufacturing facility to internal or external flow-loop test facilities. The logistics footprint depends on valve weight, distance, truck utilization, return movement, packaging, and special handling. To understand the impact lets take an illustrative example. For example, a Bray ASME Class 300 Series 4B Double Flanged butterfly valve in NPS 42 has a published weight of 5,475 lb (~2,500 kg). If a prototype of this size were transported from Houston to the Utah Water Research Laboratory in Logan, Utah, the one-way road distance would be approximately 1,637 miles (2,600 km). Using an average U.S. freight truck factor of 161.8 g CO₂ per short ton-mile (110.8 g CO₂/tonne-km), the round-trip transport footprint for this single valve body alone would be roughly 1.45 metric tons CO₂. This excludes packaging, fixtures, actuators, test adapters, loading equipment, special handling, storage. This is not a claim about an actual shipment; it is an illustration to quantify how transportation can become part of the hidden footprint.
Transportation Footprint
Physical Testing Footprint
The operational footprint of a flow-loop test becomes clearer when the test is viewed as a sequence of operating points. A valve tested from 10% to 100% opening in 10% increments, with three flow/pressure combinations at each opening, requires 30 stabilized test points. This can mean several hours of pump operation and more than a thousand cubic metres of test media circulated through the loop.
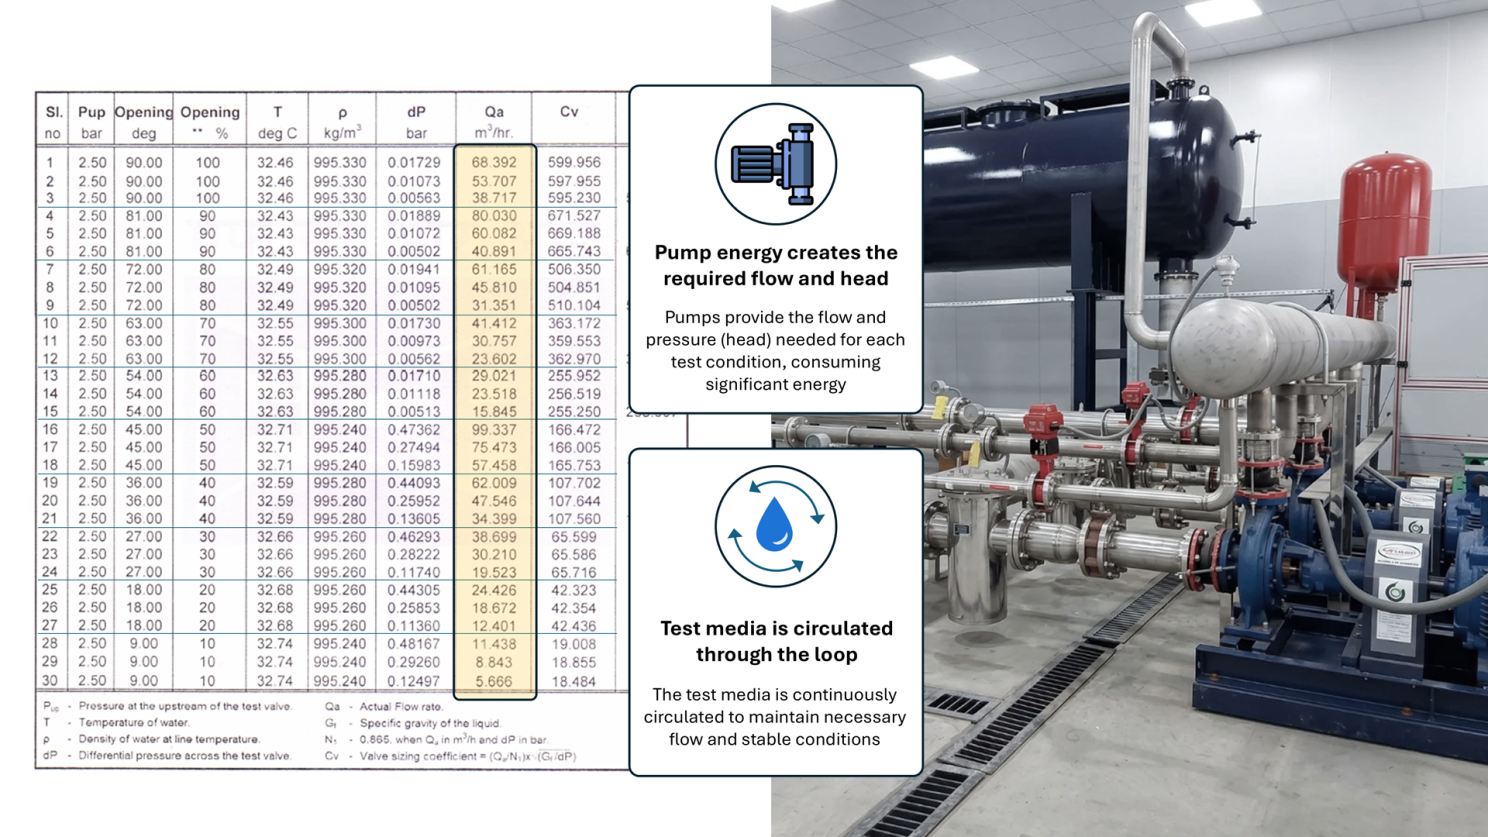
Valve Environmental Product Declarations (EPD) sample data
A typical valve development cycle involves several rounds of design iterations and their performance validation. When the same physical workflow is used for every design iteration, the footprint increases rapidly. In many cases, design teams are forced to limit the number of iterations they explore, not because they lack ideas, but because every test cycle carries cost, time, and resource constraints
That is where virtual testing begins to change the equation.
What Castel’s example tells the valve industry
A published case from Castel, an Italian valve manufacturer, provides a useful benchmark for the industry.
At the ATMO Summit, Alessandro Farina, Application Manager, Castel presented how it studies and designs components using numerical computational simulation as part of its approach to reducing carbon footprint, cost, and resource consumption. (Source)
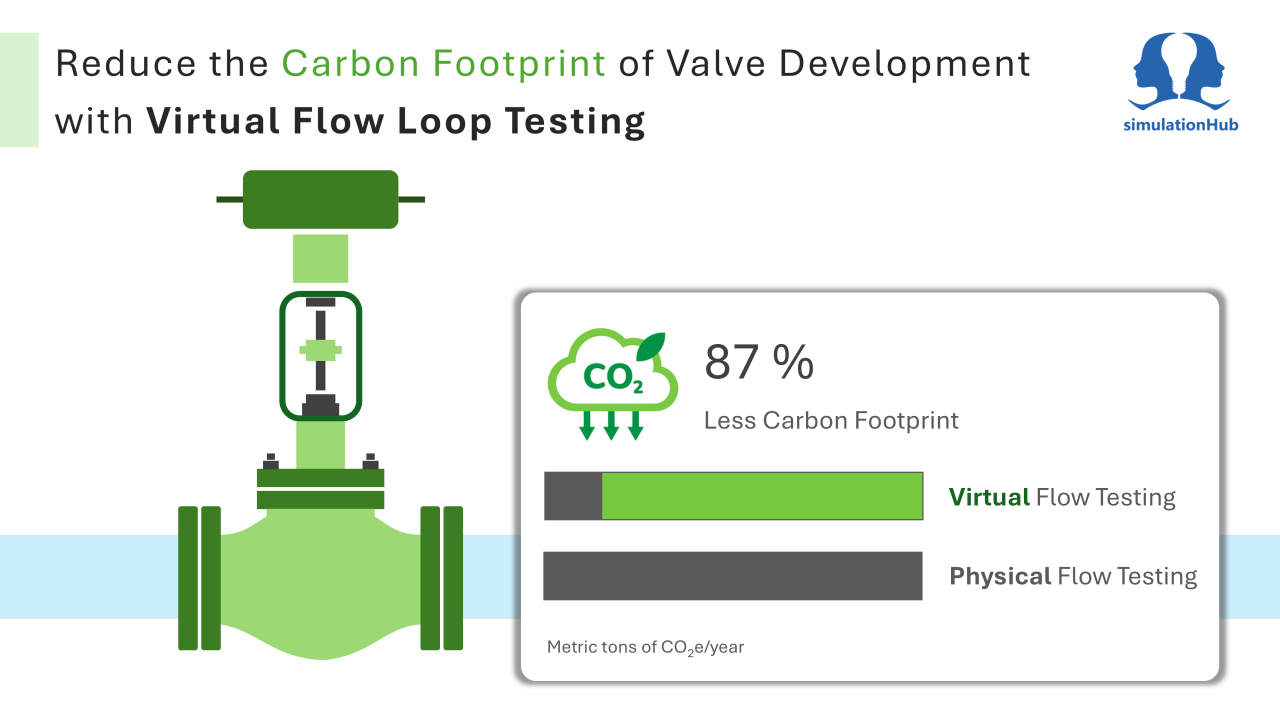
In the reported case, Castel evaluated more than 500 tests on around 2,000 product samples, including safety valves and expansion valves. The company found that virtual product testing could reduce testing-related carbon emissions by up to 87% compared with physical testing. The reported carbon footprint was about 310 metric tons of CO₂e for physical tests versus about 40 metric tons of CO₂e for virtual tests.
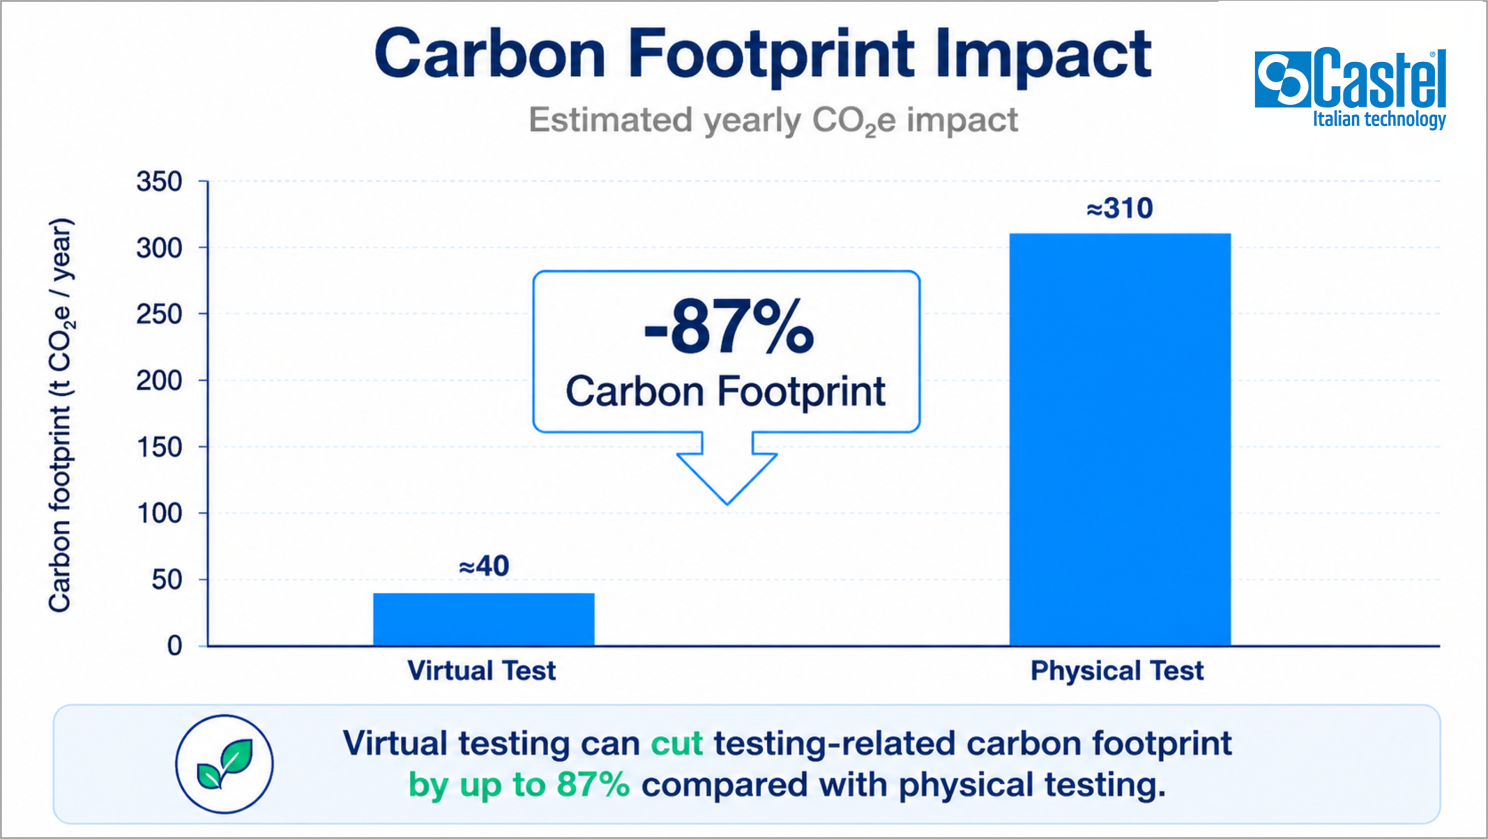
Carbon Footprint Comparison of Physical vs Virtual Testing (Source: Castel)
The same case also reported that virtual testing required only 10% of the product samples needed for physical testing and saved up to 95% of the cost associated with physical tests.
For valve manufacturers, this is a critical shift in perspective. Sustainability in product development is not only about what is manufactured. It is also about how many times something must be manufactured, tested, modified, and tested again before the final design is reached.
From ‘Test-First’ to ‘Simulate-First’
The traditional product development workflow often looks like this:
Design → Prototype → Physical test → Redesign → Retest
Design → Prototype → Physical test → Redesign → Retest
A more efficient and sustainable workflow is:
Design → Virtual flow-loop test → Optimize → Prototype → Physical validation
Design → Virtual flow-loop test → Optimize → Prototype → Physical validation
Here, the physical testing remains essential. It is required for final validation, certification, internal quality systems, customer acceptance, and compliance with applicable standards. At the same time, Computational Fluid Dynamics (CFD) simulations act as the everyday decision-making tool that guides the design before material, machining, logistics, and lab resources are committed.
The challenge is that conventional CFD requires specialized expertise, CAD cleanup, fluid volume extraction, meshing, solver setup, high-performance computing, and post-processing. For many valve manufacturers and design teams, this makes CFD too slow or specialized for everyday design decisions.
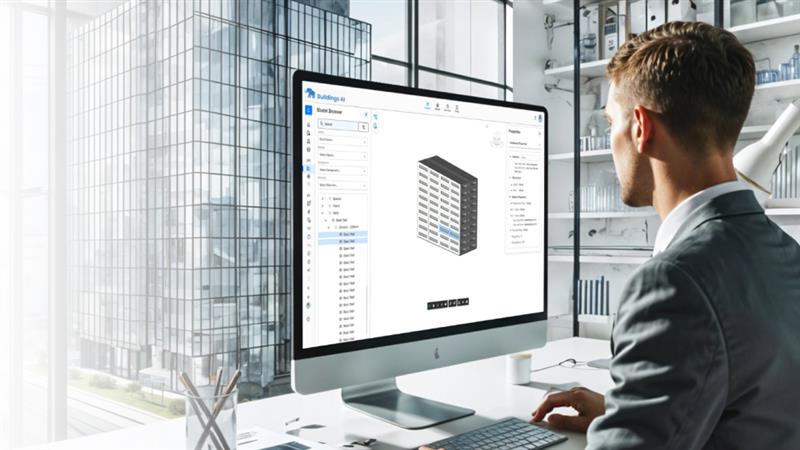
Autonomous Valve CFD (AVC), bridges this gap by making valve CFD accessible to valve design engineers.
Where Autonomous Valve CFD fits
Autonomous Valve CFD (AVC) is a specialized app for valve simulations and virtual flow loop testing. From a valve CAD model, design teams can evaluate flow performance parameters such as Cv, hydrodynamic torque coefficient, head loss coefficient, and cavitation index.
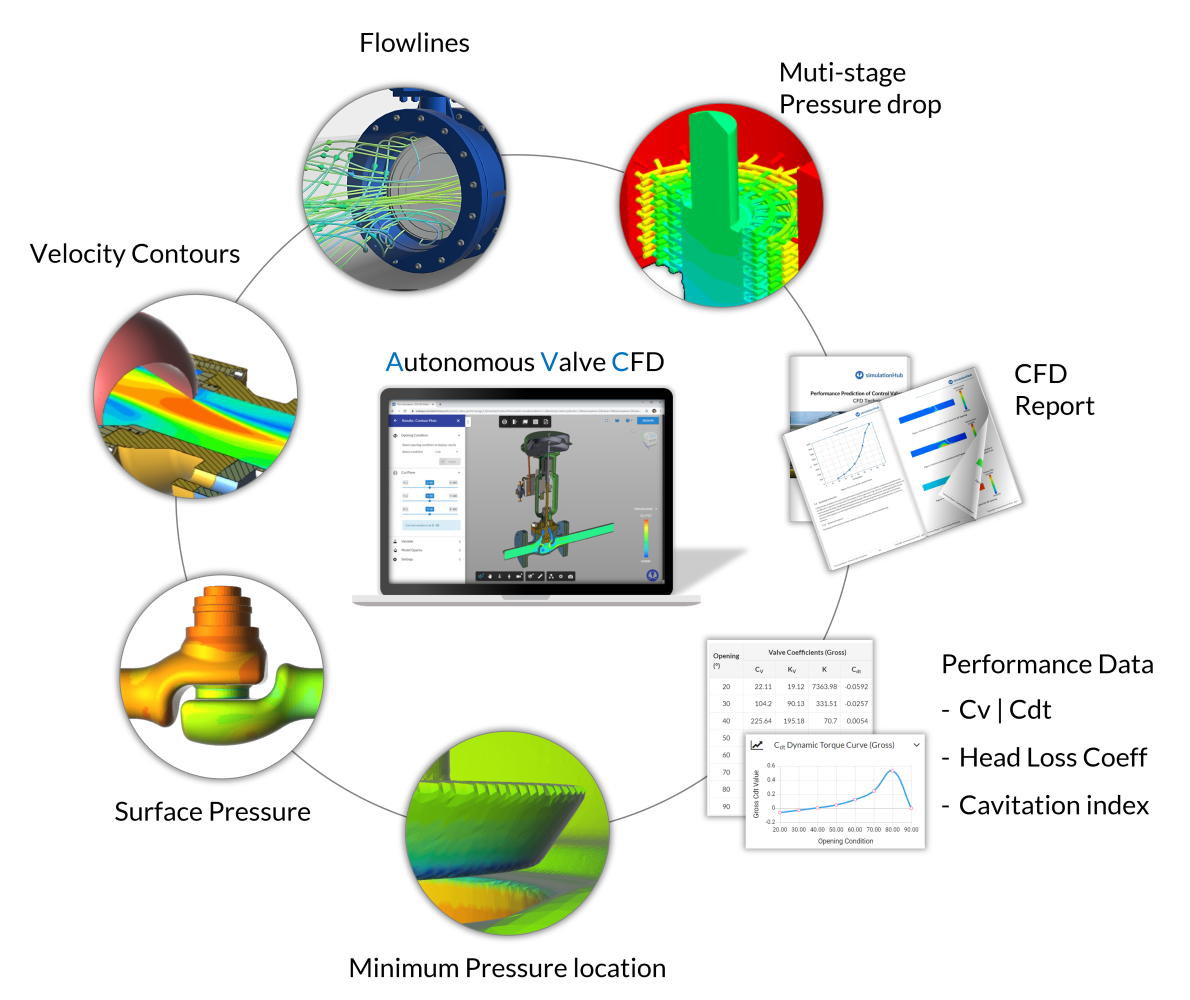
Autonomous Valve CFD (AVC) app workflow
It is built to make virtual flow-loop testing practical for valve design teams. The workflow is designed around the valve designer: the user provides the valve CAD model, flow direction, and opening conditions, and the app generates CFD results and a ready-to-use performance report.
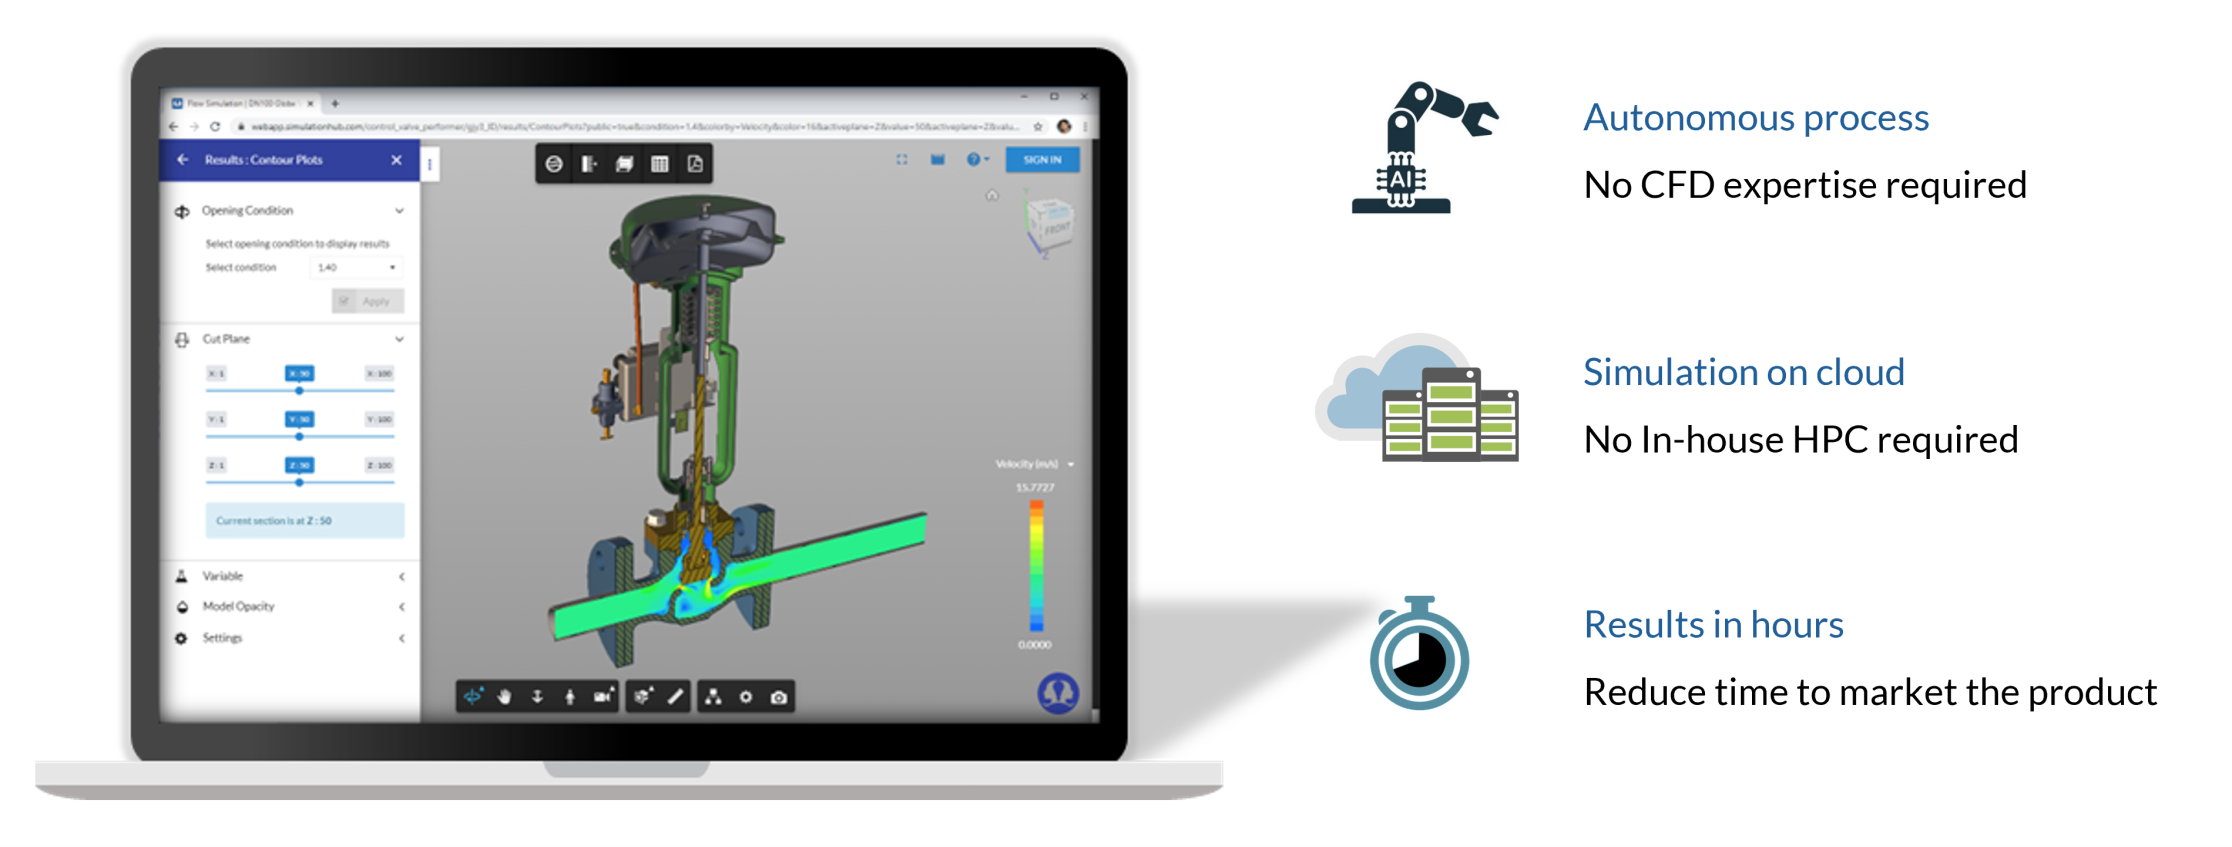
Autonomous Valve CFD (AVC) solution benefits
Conclusion
Physical testing will remain an important part of valve development. But it should not be the first and only way to answer every design question. As valve manufacturers face pressure to innovate faster, reduce costs, and support ESG goals, virtual flow-loop testing offers a practical path forward. Autonomous Valve CFD helps make that possible.
Simulate first. Validate smarter. Reduce the footprint of valve innovation.
Explore the Updated AVC Website
Book a Free Demo
Comments
Recent posts